What the Day/Night Band actually records
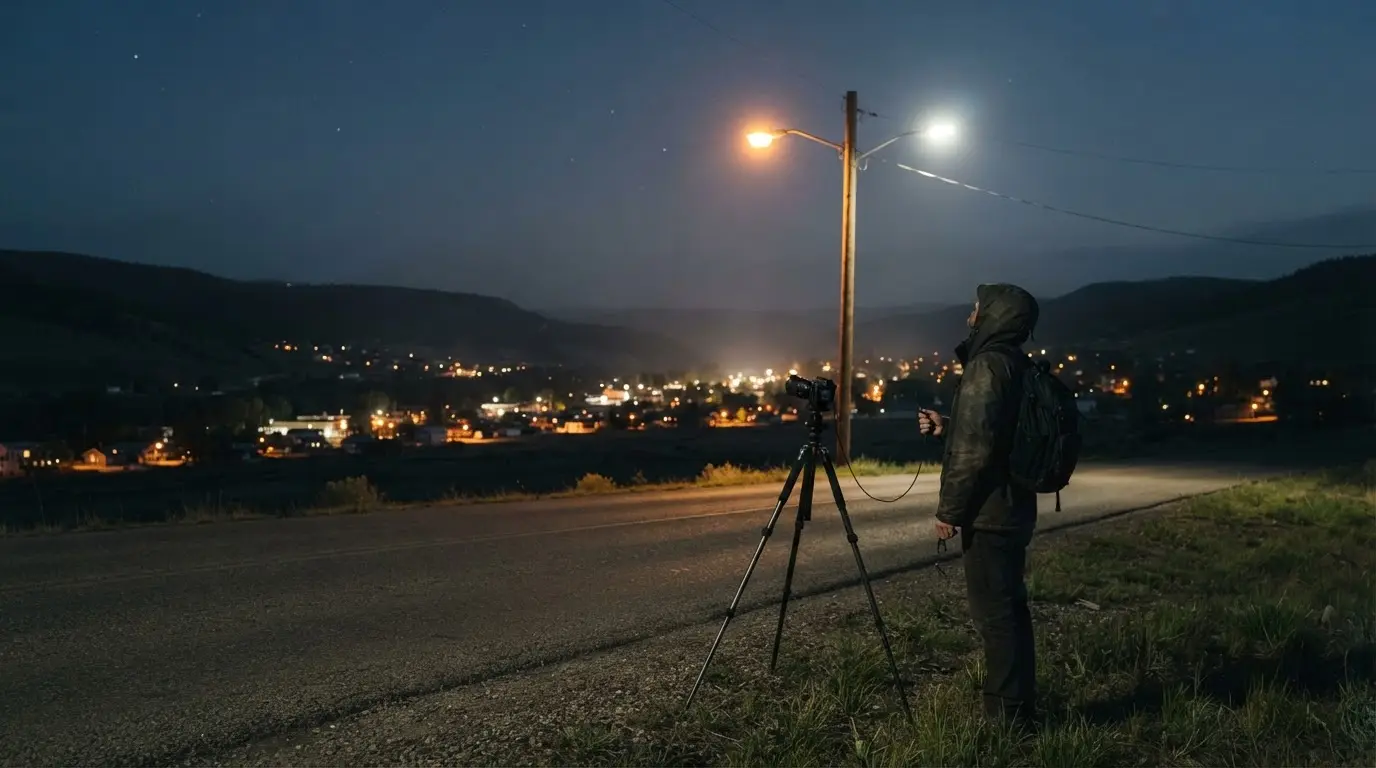
The 16% figure rests on one instrument, the Day/Night Band on the VIIRS radiometer. It records light between 500 and 900 nanometres, on a pass over the equator at roughly 1:30 in the morning[4]. Steve Miller, a Colorado State University researcher quoted on a NASA Earth Observatory page, says it can sense light 100,000 times fainter than conventional visible-light sensors[5], which makes it very good at faint light and says nothing about colour.
Colour is where the trouble starts. Visible light runs from about 400 nm for blue to 700 nm for red[6], so the band starts a hundred nanometres into the visible range and runs on into the near-infrared. The study fed VIIRS measurements through NASA's Black Marble processing[7], which strips out moonlight, aurora, cloud and vegetation shadow, and viewing-angle differences[8].
What survives is radiance, light leaving the ground and heading up. Radiance is not light pollution as a stargazer experiences it: skyglow, the haze that erases faint stars, is a different quantity.
Why swapping to LEDs can read as dimming from orbit
Christopher Kyba of Ruhr University Bochum explains the mismatch in terms of wavelengths. Human night vision leans toward blue light and barely registers near-infrared, while VIIRS has no sensitivity below 500 nm and readily sees the infrared glow of high-pressure sodium lamps[13]. The instrument and the eye are, in effect, looking at different lamps.
So a street relamped from high-pressure sodium to white LED gets brighter for the person under it and darker for the satellite overhead[14]. DarkSky International puts the same point at scale: the DNB is almost completely insensitive to the strong blue emissions of white LEDs, and has largely missed the rise of the lighting now dominating light pollution in many countries[15].
Milan is the worked example. ISS photographs show its centre turning noticeably bluer after the city converted much of its municipal lighting to white LED[16], while a VIIRS-type sensor would have recorded the same conversion as the city going darker[17]. LED's share of new general lighting rose from under 1% in 2011 to 47% in 2019[18], so the satellite record runs through the very years in which the colour of the world's streetlights changed.
Featured · Article
Stargazing Gear for Beginners: Binoculars to Telescopes
New to stargazing gear? This guide breaks down binoculars, telescopes, and smart telescopes, so you know what to buy first and what to skip for right now.
How much the blind spot understates the rise has no published global answer. One quantified regional comparison is a sample: Bustamante-Calabria and colleagues set ISS photographs against VIIRS for 100 units in the north of Granada province (the Granada Geopark), 87 population centres and 13 private infrastructures, of which 79 were analysed, over 2012 to 2021[28]. In most cases VIIRS showed a rise under 5% while the ISS images showed 20 to 50%, and some more than 100%[28]. The median rise in blue-band emissions in the ISS images was 266% across those 79[29]. That is one corner of one province, not a world estimate, and it should not be scaled up.
Skyglow is what you see, and the satellite does not measure it
The Nature paper draws the line itself. Operational satellite night-light observations such as VIIRS mainly capture light emitted upward after midnight, while ground monitors of the kind behind the World Atlas measure skyglow coming down[19]. The 16% belongs to the first category and cannot be read as a change in how bright the sky looks from the ground.
Volunteers in the Globe at Night programme supply the second kind of evidence: 51,351 naked-eye star observations from 2011 to 2022[20]. Their reports are equivalent to a sky-brightness increase of 9.6% a year[3], against about 2% a year for light emissions as estimated from satellite radiance[21]. Compounded, that is a doubling of sky brightness in under eight years[22].
Featured · Destination
Northern Lights in Tromsø
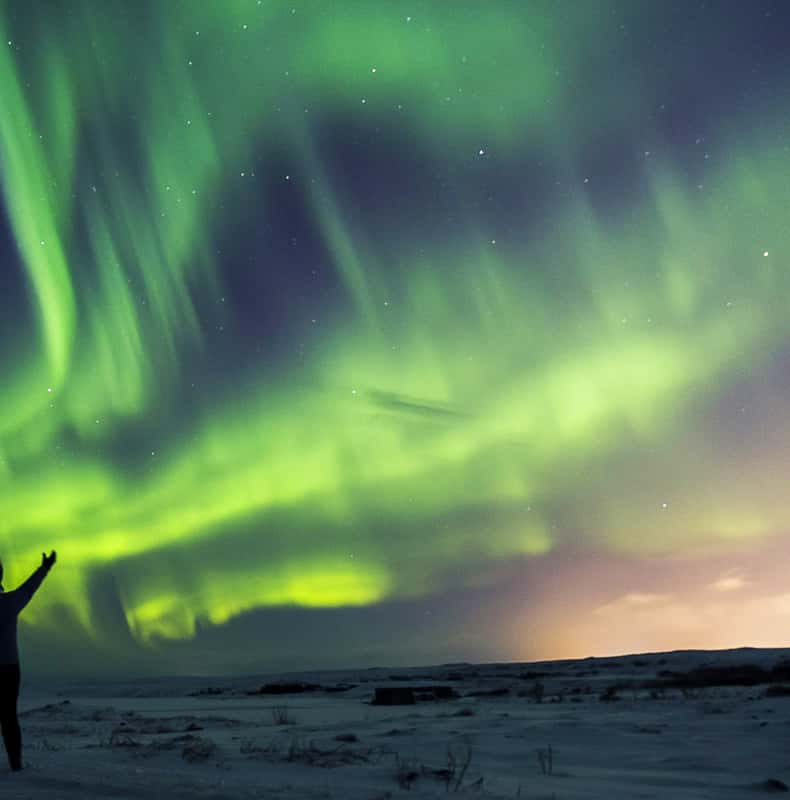
At 69.6°N inside the auroral oval, Tromsø sees aurora at Kp 2. Peak season November–February. Best viewing spots, tour advice, and aurora forecast strategy.
In star terms, a site where 250 stars are visible would be down to about 100 after 18 years at that rate[23]. The authors caution that the global figure likely understates countries with the fastest development[24], and they call the effect of the LED transition on skyglow unclear[25]. Even the ground record is a floor in some places and an open question in others.
Reading the next headline: what to trust, and for what
Orbit can see colour too, through astronaut photographs from the ISS. DarkSky International ranks them above the DMSP and VIIRS maps for resolution, picking out roads, airports and individual lit buildings[26], while the satellite maps resolve light sources at best to about a city block[27].
| Method | What it records | Strength |
|---|---|---|
| VIIRS Day/Night Band | Light emitted upward, after midnight | Planet-wide coverage |
| ISS astronaut photos | Colour and individual lit buildings | Finer detail than DMSP or VIIRS maps |
| Globe at Night star counts | What observers can see of the sky from the ground | Measures skyglow as a viewer experiences it |
My rule for planning a trip is to use satellite maps as a first filter and a ground-side measure for the final call. A VIIRS-based map can tell you which regions are broadly dark; it will misread a town that has just swapped sodium for white LED, because it files that swap under dimming[14]. A ground-side figure such as the Bortle class is built on what the sky looks like to a person.
Recommended tours
Tours are selected for quality, not commission. I earn a small fee if you book — at no extra cost to you.


For headlines, the useful question is which quantity is being reported. A 16% satellite rise and a 9.6% annual ground rise both get called brightening, yet one counts upward light and the other counts stars. No global estimate says how far the blue-end blind spot understates the rise, but Kyba's 2017 team put the direction plainly: surface brightness and skyglow over cities are increasing, probably even where the satellite detects less radiation[30].