
What the Kp index actually measures

The Kp index runs from 0 to 9 and measures the maximum horizontal fluctuation of Earth's magnetic field during consecutive three-hour windows. Zero means quiet: the Sun is calm, Earth's magnetosphere is relaxed, and aurora sits tucked close to the magnetic poles. Nine means an extreme storm, the kind that pushes aurora visible from Central Europe and the mid-latitude United States.
NOAA's Space Weather Prediction Center calculates the figure from data collected at 13 magnetometer stations positioned across a range of latitudes and longitudes around the globe[1]. Each station measures the horizontal component of Earth's magnetic field during its three-hour window, producing a local K value. NOAA converts those local readings using station-specific calibration tables, then combines them into the single planetary number that apps and alert services publish.
A Kp of 5 or above officially classifies as a geomagnetic storm. NOAA grades these on the G scale[5]:

13

NOAA averages K readings from 13 magnetometer stations worldwide into a single planetary figure, updated every three hours.
  • G1 (minor storm): Kp 5
  • G2 (moderate): Kp 6
  • G3 (strong): Kp 7
  • G4 (severe): Kp 8 to Kp 9-
  • G5 (extreme): Kp 9
Below G1, aurora is active but confined to polar regions. At G1 and above, the auroral oval begins expanding toward latitudes where most aurora destinations sit.
The label has German roots: Kennziffer means characteristic digit, and it's the word the index's name literally abbreviates. Julius Bartels, a postdoc at the Potsdam magnetic observatory, introduced the local K-index in 1938 and extended it into the planetary, three-hour Kp index in 1949. GFZ Potsdam, the German Research Centre for Geosciences, became the index's official producer in 1997, and the Kp record stretches back to 1932.
The number also comes out twice. An estimated Kp posts in near real time, a few times a day, as data streams in from the observatory network — that's the value every forecast app and alert service is built to surface. A final Kp follows later, once GFZ Potsdam has fully quality-checked every station's reading, typically about a month afterward. For same-night decisions, the estimated value is the only one that matters; waiting for the finalized number defeats the purpose of planning around tonight's sky.

How your latitude determines what Kp you need
Two places at the same line on the map can have completely different aurora odds. What determines your chances is magnetic latitude, which measures distance from Earth's magnetic poles rather than its geographic ones. Earth's magnetic north pole sits over the Canadian Arctic, tilting the auroral oval away from the geographic north in ways that favor some destinations over others.
Tromsø, Norway is positioned at around 70°N geographic latitude and a magnetic latitude of roughly 67°N MLAT. On a quiet night with Kp 1 or 2, aurora is frequently visible there. Scotland has a considerably lower magnetic latitude and typically needs a much more disturbed field, generally Kp 5 or above, before observers see a useful display. London, farther south, requires Kp 6 or above.

Featured · Destination

Abisko Stargazing

Abisko's rain-shadow microclimate keeps skies clear when nearby Arctic spots cloud over. Aurora season, the Sky Station, ICEHOTEL, and getting there by train.

As a general rule, the lower your magnetic latitude, the higher the Kp reading you need before aurora becomes visible. Treat any specific threshold as a planning orientation rather than a prediction; local conditions and the exact position of the auroral oval at any given moment shift the result.
In practical terms:
  • Kp 0-2: aurora confined to the highest latitudes. Svalbard, northern Iceland, northern Alaska and Canada.
  • Kp 3-4: subarctic regions including Tromsø, Abisko, Fairbanks, and Reykjavik.
  • Kp 5: Scotland, southern Scandinavia, the northern US-Canadian border region.
  • Kp 6-9: mid-latitudes, central Europe, and the US Midwest. Uncommon and memorable when they happen.

What drives Kp spikes: CMEs and coronal holes

Two distinct events on the Sun raise the Kp index. They behave differently and give forecasters very different warning windows.
A coronal mass ejection (CME) is a billion-ton burst of magnetized plasma thrown outward from the Sun, typically from an active region or solar flare[4]. CMEs drive the strongest auroral displays. At typical speeds, a CME takes 15 to 72 hours to travel from the Sun to Earth, while the flash of a solar flare arrives in just 8 minutes[3]. That lag between the light flash and the particle cloud is what makes aurora forecasting possible: once a CME launch is detected by satellite, there is a warning window before the plasma arrives.

15–72 hours

Typical travel time for a coronal mass ejection from Sun to Earth. A solar flare's light arrives in 8 minutes; the magnetized plasma cloud that triggers aurora follows hours or days later.
Coronal holes work differently. When open magnetic field lines allow the fast solar wind to escape from cooler regions of the Sun's atmosphere, a steady stream of energetic particles flows outward for days. This produces a milder, more predictable Kp uplift than a CME. Coronal hole streams also tend to recur on a 27-day cycle as the Sun rotates, so if a coronal hole produced a Kp 4 event this month, that same region may be Earth-facing again roughly four weeks later. The resulting displays are quieter than CME-driven storms but useful for planning.

The Bz factor: what Kp doesn't show you

The Kp index measures the effect of solar wind on Earth's magnetosphere. It does not show the mechanism that determines whether a given solar wind event will produce a strong effect. That mechanism is the Bz component of the interplanetary magnetic field (IMF): the north-south orientation of the magnetic field embedded in the solar wind.
When Bz turns southward (recorded as a negative number, particularly below -10 nanoTesla[3]), the IMF couples with Earth's magnetic field in a process called magnetic reconnection. Energy pours from the solar wind into the magnetosphere, charged particles funnel toward the poles, and the Kp index rises. When Bz stays northward, even a fast solar wind stream may barely disturb the field. This is why two solar events with similar arrival velocities can produce very different Kp outcomes.
Solar wind speed compounds the effect. A southward Bz of -15 nT at 400 km/s is less effective than the same reading at 700 km/s. Apps that display only the Kp number leave out the data that explains why forecasts sometimes miss. NOAA real-time monitors track both readings from satellite data; SpaceWeatherLive surfaces the Bz and solar wind speed alongside the Kp in a readable format.

Read next · Article

Do You Need a Tour to See Northern Lights in Tromsø?

You don't need a tour for northern lights in Tromsø. The choice turns on winter driving confidence, budget, and whether you prefer certainty over flexibility.

A practical rule of thumb: a forecast showing Kp 5 with a slightly positive Bz warrants measured expectations. A forecast with Kp 4 and a Bz sitting at -20 nT for several consecutive hours might produce a better display than the headline number suggests. Check the Tromsø northern lights FAQ for location-specific advice on reading conditions before a trip.

Beyond Kp: clouds, darkness, equinoxes, and Solar Cycle 25

The Kp reading is one of five variables that determine whether you will actually see aurora on a given night. Four others shape the outcome just as directly.
Cloud cover is the most defeating and the most overlooked. An opaque overcast sky blocks aurora completely, regardless of how high the Kp climbs. Check a local cloud forecast on the day itself, not the week before, and stay flexible enough to drive toward clearer sky if your first spot closes in. Yr.no provides detailed cloud and precipitation forecasts for Arctic Norway and is more reliable for that region than most international weather services.
Hours of darkness set the hard limit at high latitudes. Between late May and late July, Tromsø has near-continuous daylight; the aurora may be active but is invisible. Most northern destinations offer a reliable viewing window from late August through mid-April, when nights are long enough for true darkness to return. The how to see the northern lights guide covers moon-phase planning in detail.
Moon phase matters for fainter displays. A full moon washes out a low-Kp aurora the same way it washes out the Milky Way. A G2 or G3 storm overrides this, but on quieter nights, planning around a new-moon window gives your eyes the best chance of picking up a modest display.
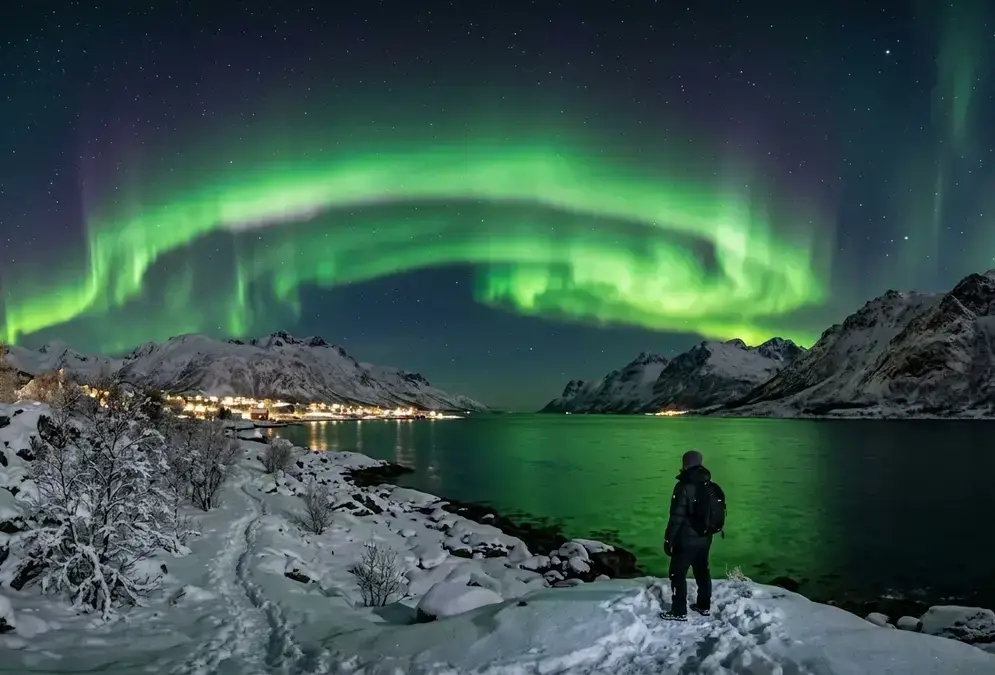
A wide green aurora borealis curtain over a snow-covered Arctic fjord at night in northern Norway, showing the kind of display that happens during a Kp 4 geomagnetic storm, the core concept behind kp index northern lights explained

A wide green aurora borealis curtain over a snow-covered Arctic fjord at night in northern Norway, showing the kind of display that happens during a Kp 4 geomagnetic storm, the core concept behind kp index northern lights explained

Solar Cycle 25 began in December 2019, and NASA and NOAA jointly announced in October 2024 that the cycle's solar maximum had already occurred[6]. By 2026, the cycle is past its peak and moving into its declining phase, though elevated aurora activity often persists for a year or more after the sunspot maximum passes. That means higher-than-average sunspot counts, more frequent solar flares, and a still-elevated frequency of strong CMEs, even as the underlying trend points downward. The cycle runs on an 11-year rhythm, and the decline toward solar minimum typically takes several years. Individual storms remain impossible to predict beyond a few days, but the lingering elevated baseline keeps the Kp crossing G2 and above more often than it will once the cycle bottoms out.
The equinox effect adds a seasonal dimension. Geomagnetic activity tends to cluster more often around the September and March equinoxes than the solstices, a pattern driven by how Earth's magnetic field lines up with the solar wind around those dates, sometimes called the Russell-McPherron effect. If you are timing a trip, late September and mid-March carry slightly better statistical odds than an equivalently priced January or July booking.
Timeline
  1. Late August

    Viewing season begins

    Nights grow long enough at most northern destinations for true darkness to return.

  2. September equinox

    Geomagnetic activity ticks up

    The Russell-McPherron effect favors more frequent storms near the equinox, making late September one of the better statistical windows.

  3. March equinox

    A second activity peak

    The same magnetic alignment repeats in spring. March and early April combine reasonable darkness with elevated storm odds.

  4. Late April

    Viewing season ends

    Nights grow too short and too bright at high latitudes for the aurora to stand out against the sky.

Tools worth using for aurora forecasting

The most useful aurora tools layer multiple variables rather than reducing everything to a single Kp number.
NOAA's Space Weather Prediction Center (spaceweather.gov) is the primary data source: the Kp index, a 3-day geomagnetic outlook, and real-time satellite data including the Bz reading and solar wind speed. It is what every aurora app draws from, without delay. The interface is functional rather than polished, but the data is current and authoritative.
SpaceWeatherLive.com and its companion app take NOAA data and add a cleaner interface with Kp history graphs, live Bz trends, and threshold alerts. Set a Kp alert for your destination latitude and it will notify you when conditions cross that level.
AuroraMe translates the index into plain-language local visibility estimates, useful if you prefer not to convert numbers yourself. Its forecast interface is designed for non-specialists who want a direct answer rather than raw data.
Yr.no from the Norwegian Meteorological Institute is not an aurora app. It is Norway's public weather service, and its cloud cover and atmospheric forecasts for Arctic Norway are more detailed than most international alternatives. Use it alongside one of the above for cloud cover data, not as a substitute for the Kp and Bz readings.
For advice on where to position yourself once the forecast turns promising, best aurora spots in Tromsø covers the practical choices in the region that sees more aurora tourism than anywhere else in northern Europe.