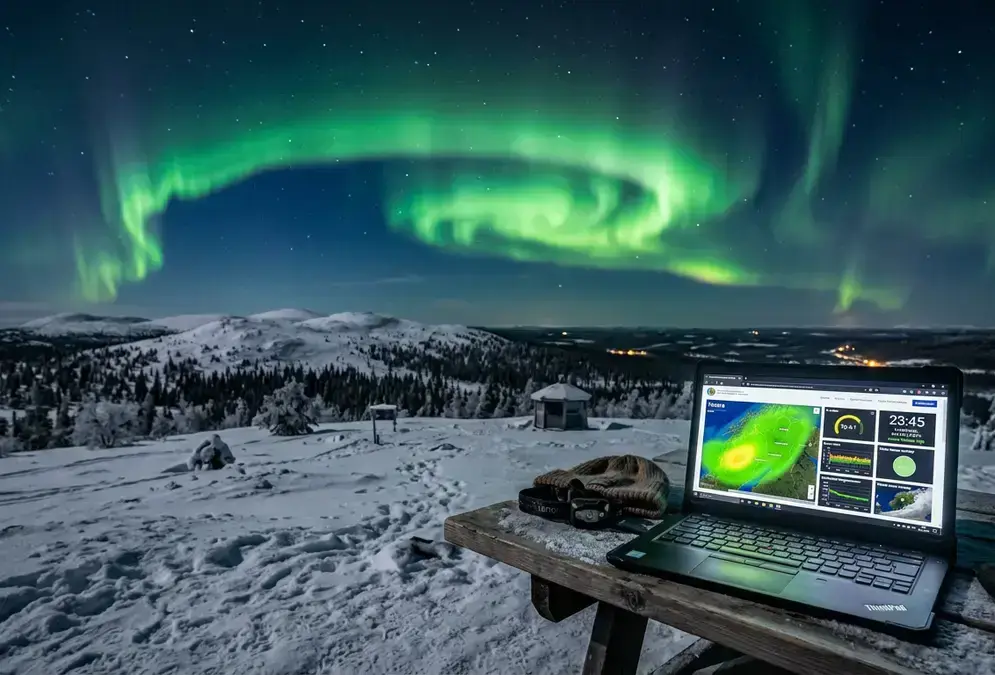

Reading the R-Index: Thresholds and What They Mean
FMI's R-index measures the rate of change of Earth's magnetic field within a ten-minute interval, and each station carries two threshold values: cross the lower one and auroras are usually dim; cross the upper one and they're very likely visible[2].
The forecast page renders this as a bar chart and a station map, colour-coded by a two-tier alert:
- Yellow: lower threshold crossed, auroras possible but likely faint
- Red: upper threshold crossed, auroras very likely visible
Refresh the page every 5 minutes while you're actively deciding whether to head out; the R-index is built for exactly that kind of short-interval decision, not a once-a-day glance.
University of Oulu's Sodankylä Observatory: the Data Behind the Number
FMI's R-index doesn't come from nowhere. Measurements for the Sodankylä station, one of the network's key inputs, come from the Sodankylä Geophysical Observatory, run by the University of Oulu[3]. That academic station feeds directly into FMI's public forecast rather than sitting off to the side as a separate tool.
You can check Sodankylä's raw magnetometer traces directly at the observatory's own page, useful if you want the technical data behind the forecast rather than FMI's formatted version. For most travelers, though, FMI's own page already does the useful work of translating that raw signal into the yellow-and-red alert system covered above; the direct Sodankylä feed is a reference for the technically curious, not a replacement for the main forecast.
Featured · Destination
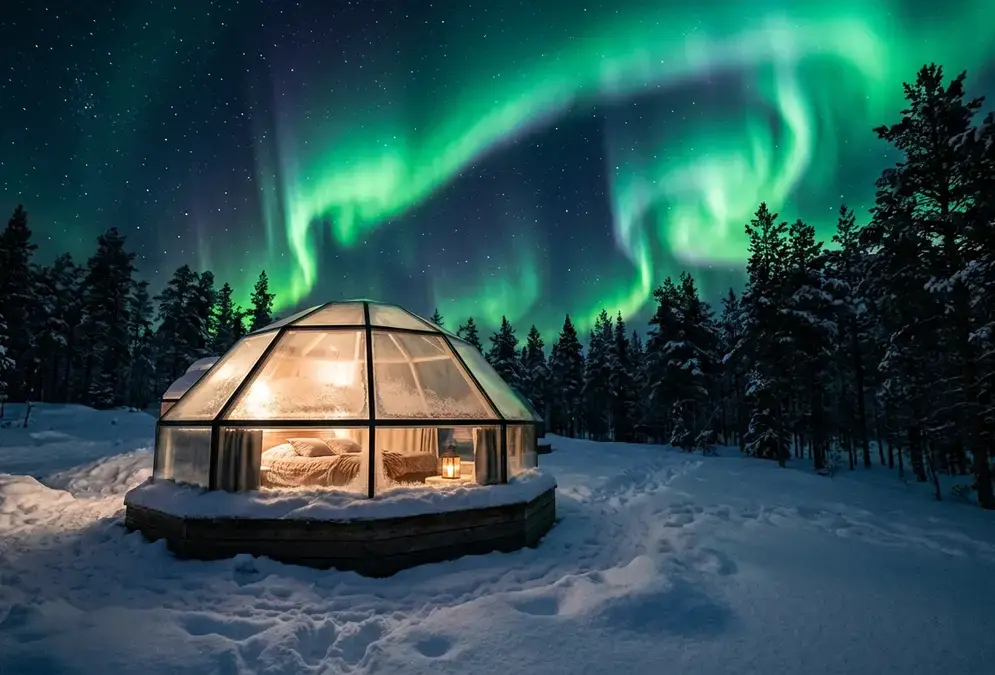
Northern Lights in Finnish Lapland
Finnish Lapland's whole-region aurora guide: glass igloos, Santa Claus Village, six bases from Rovaniemi to Inari, aurora season Sep–Mar, no road drama.
This is also the detail that separates Lapland's forecasting infrastructure from most other aurora destinations: the number you're checking isn't a repackaged global model, it's built from stations physically inside the region you're standing in.
NOAA's Kp Index as a Secondary Check
NOAA's Space Weather Prediction Center runs the global Aurora 30-Minute Forecast, built on the standard 0-to-9 Kp index and updated roughly every 30 minutes[4]. In Finnish Lapland, aurora typically becomes visible once Kp reaches 3 to 4, and more intense storms push the display further south across the country.
Recommended tours
Tours are selected for quality, not commission. I earn a small fee if you book — at no extra cost to you.


Treat NOAA as a background check, not your nightly decision tool. It's useful for longer-term trend planning, spotting a promising geomagnetic storm building several days out, and as a sanity check if FMI's R-index looks unusually high or low. It wasn't built with Finland's regional station network in mind, so once you're actually in Lapland deciding whether to head out tonight, FMI's page is the more localized, more frequently updated call.
Read next · Guide
Best Aurora Forecast Apps for Chasing the Northern Lights
My Aurora Forecast, SpaceWeatherLive, Glendale, Hello Aurora, and AuroraWatch UK compared: what each shows, what's free, and who each app actually suits best.
For the mechanics of what Kp measures and how it translates across latitudes generally, Kp index explained covers that in full. Consumer apps such as the ones covered in best aurora forecast apps mostly repackage that same NOAA feed; none of them plug into FMI's Finland-specific magnetometer network the way the method in this guide does.
Building Your Go/No-Go Decision
The workflow that actually works combines FMI's R-index with a basic sense of the season and viewing hours, on a schedule rather than a single check.
- A week out: scan FMI's forecast page for any night the R-index trends toward yellow or red in your region; shortlist two or three candidate nights.
- The day before: recheck the same page. Readings shift as solar wind data updates, so confirm your shortlisted night still looks promising.
- A few hours before you head out: do the final 5-minute-refresh check. Best viewing generally falls between 9 PM and 1 AM local time[5].
| R-index reading | Sky condition | Verdict |
|---|---|---|
| Red (upper threshold) | Clear | Go: strong display likely |
| Red (upper threshold) | Overcast | No-go: cloud blocks even a strong reading |
| Yellow (lower threshold) | Clear | Maybe: worth a look, expect a faint display |
| No threshold crossed | Clear | Low odds: check back in a few hours |
Best viewing months, September-October and February-March, line up with the equinoxes, when geomagnetic activity tends to spike and temperatures stay more manageable than deep winter. December and January's kaamos gives the longest dark windows of the year, but a promising R-index reading still means nothing under a fully overcast sky; check Finland's standard weather forecast alongside FMI's aurora page, not instead of it. Once you've locked in the season, pair this forecast method with how many days in Lapland for northern lights to decide how many nights give the R-index room to find a clear one.
Common Mistakes When Reading Finland's Aurora Forecast
A handful of habits account for most of the disappointed aurora nights in Lapland, and nearly all of them come from checking the wrong tool, or checking the right one only once.
- Defaulting to a generic Kp app instead of FMI's page. A global Kp reading doesn't capture Finland's regional station network the way the R-index does; use FMI first, NOAA second.
- Checking once and committing for the night. The R-index refreshes on a short cycle; a forecast checked at dinner can be stale by 10 PM.
- Ignoring the season. September-October and February-March give the best mix of geomagnetic activity and manageable weather; deep winter's kaamos offers more darkness but colder, sometimes overcast, conditions.
- Skipping the plain weather forecast. A red R-index reading under solid cloud cover is exactly as visible as a quiet night, not at all.
Whichever base you're hunting from, whether that's Ounasvaara in Rovaniemi or Lake Inari's frozen shore, covered in best northern lights spots in Lapland, the forecast method is identical: check FMI's R-index, cross-reference the season and clock, then step outside.